With your data securely stored in the cloud you can create visual dashboards that combine different data sources, no matter how simple or complex, into a single view including bar graphs, pie charts, etc. You and your customers can view key performance indicators from your machines in real or near-real time using the runtime dashboard.


Dashboards for a great overview
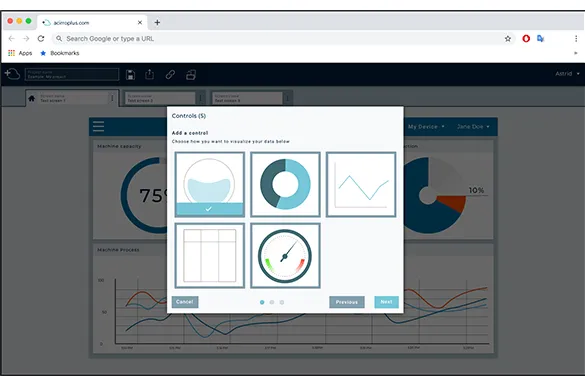
Easy visualization
Use widgets and templates to easily build dashboards including bar graphs, pie charts and more.
Complex data visualized
Consolidate complex data across similar machines and visualize them in acirro+ dashboards for great overview.
Cloud-based and mobile ready
Dashboards draw data from the cloud and present them on mobile, pc or tablet platforms.
Real-time data feeds
View key performance indicators from your machine in real or near-real time using runtime dashboards.